Volume is arguably the most valuable leading indicator in trading. Some of the most profitable professional traders trade almost exclusively off of volume and never look at price charts. It is important because it allows traders to take a sneak peak into where price action is heading by analyzing order flow. For every buyer, there needs to be a seller to complete the transaction, and vice versa. The more exchanges that take place between buyers and sellers, the more volume rises. This battle between buyers and sellers causes price to fluctuate, and volume can be used to determine whether a move in price is going to resume or to find a top/bottom.
Volume and order flow information is available to everyone, yet few traders know how to use it to their advantage. If implemented correctly, analyzing volume can become any investors new best friend. There are three general principals for analyzing volume and order flow that we will cover:
Continuation of a Trend
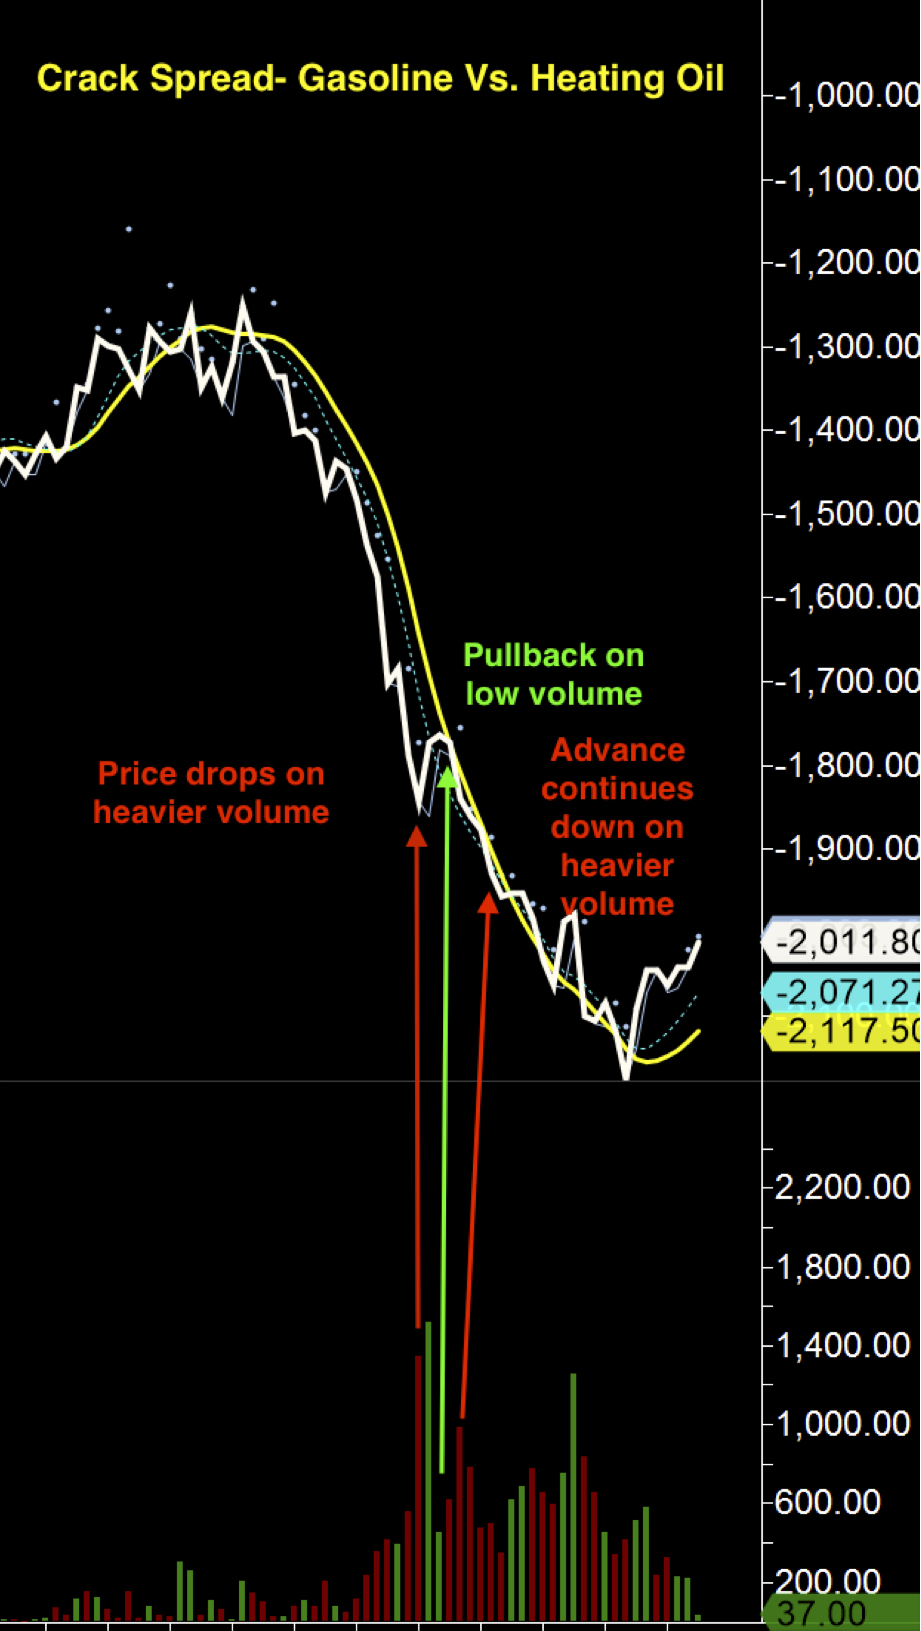
A rise in volume during an advance, with pull backs that occur on low volume, usually indicates a continuation of the advance.
In a situation where price is rising fast with increasing volume, we can assume there are more buyers than sellers pushing the price up. Pullbacks on light volume, following advances on heavy volume, are usually due to buyers closing their long positions and locking in profits.
This can also be applied to the opposite situation, where volume rises during a substantial move down in price, followed by lighter volume on the pullbacks, as shown in the graphic.
Detecting Tops/Bottoms
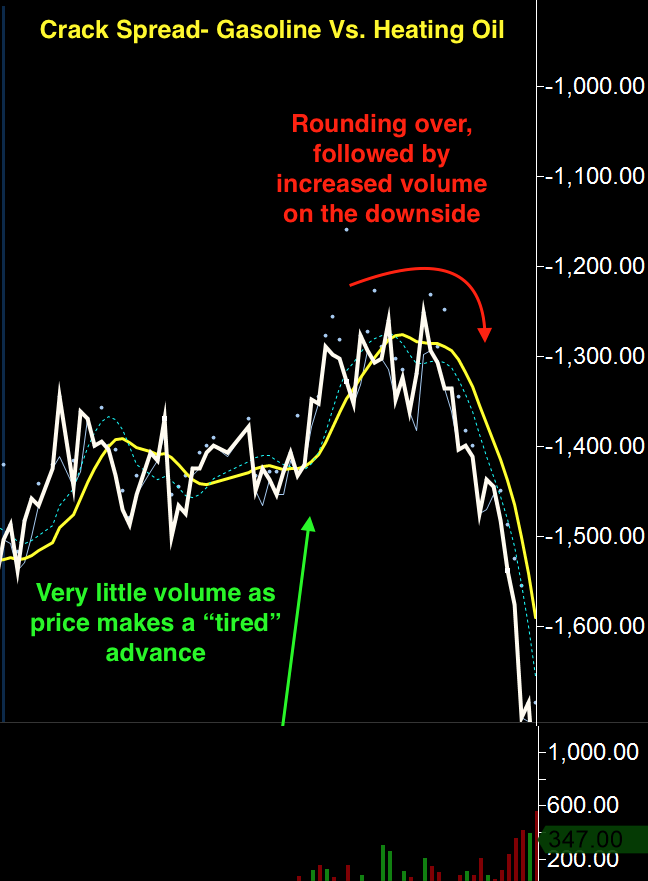
A struggling advance, where price rises slowly on light volume, and then peters out at the top, usually signals a “rounding over”. This “sluggish top” may be followed by increased volume on the downside. This usually occurs when demand is lacking and selling-orders are light. If this “tired” advance spans over several days, it will usually be followed by a sudden reversal to the downside due to demand drying up.
The same can be said about the opposite scenario, where a financial instrument slowly declines in price on light volume. This is usually followed by increased volume to the upside, raising prices.


Price Reversals
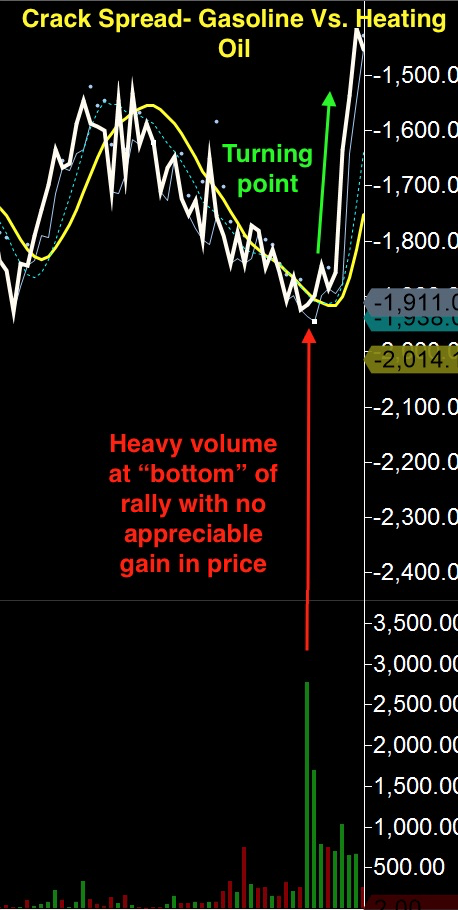
An increase in volume at the top of a rally, lasting for a while, with no substantial gain in prices, is usually indicative of a turning point or a “top”. This is a tug-of-war scenario, where an increasing number of long positions are offset by an increasing number of short positions. The active battle between buyers and sellers unfolds as the buyers buy more shares, and the sellers, who previously would only sell at higher prices, begin to unload.
This principle also applies to the opposite scenario, where we see heavy volume at the bottom of a rally, followed by a reversal in price to the upside.

Conclusion
Trading with volume and order flow is one of the most effective ways for trading a short term strategy. Many professional trades will tell you that it is essential and that trading without volume, is like trading blind.
If you want to learn to trade with volume and order flow, there is an excellent book that we recommend by Humphrey B.Neill called Tape Reading & Market Tactics.


archimo
January 21, 2017 at 3:22 pmThis is a very good reminder of what really moves price. I think you should do an article on Volume Profile which is usually at the side of ones charts. There are places of importance indicated by cumulative volume. Dalton developed the fundamentals of Market Profile which includes Volume Profile analysis.