
In a previous post on Yield Curve Trading I list all the popular yield curve spreads that institutional and professional traders watch. The TUT spread is the 2-year over the 10-year Treasury futures spread. It’s a pairs trade that’s the difference between the notional values of the two contracts (cash value of the contracts).
This spread is considered significant with regard to the shape of the yield curve, giving traders a clue as to where yields may be heading. The yield curve plots the yields of all the different maturity treasury products, from the 3-month to the 30-year. Economists use the shape of the yield curve to predict future economic conditions.
Is The Yield Curve Steepening or Flattening?
The basic strategy for yield curve trading is to determine whether the curve may steepen or flatten. This will provide you with the primary direction you want to trade. You go long the spread if you believe the curve will steepen, and short the spread if you believe it will flatten.
A steepening curve is one where long term yields are increasing faster than short term yields. And a flattening curve is one where short term yields are rising faster than long term yields. Keep in mind that the price of Treasury futures is inverse to yield.
How to Trade Steepeners and Flatteners
When you put on a steepener, you are going long the front leg of the spread (2-year) and short the back leg of the trade (10-year). Remember price is inverse yield, so you would be expecting the yield of the Front leg (2-year) to underperform the yield of the Back leg (10-year). So a steepener is used when you think longer term yields will be rising faster than shorter term yields.
When you put on a Flattener, you are going short the Front leg (2-year), and long the Back leg (10-year). You’re expecting shorter term yields to rise faster than longer term yields.
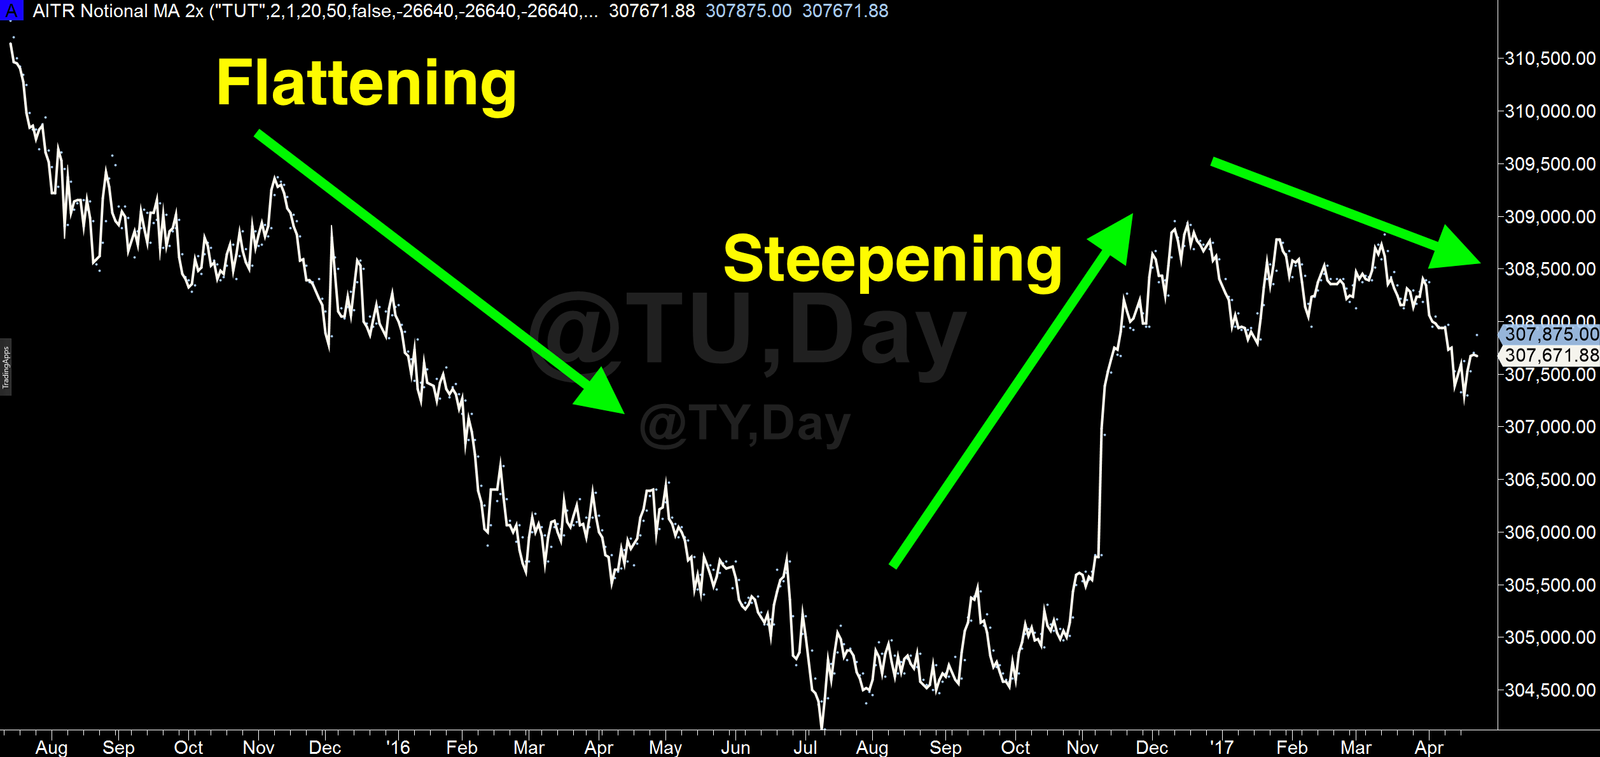
With a longer term notional chart of the TUT spread you can visualize the steepening and flattening of the yield curve. When trending up, the yield curve is steepening, and when trending down, it’s flattening..
Trading with the Proper DV01 Ratio
When trading the TUT, as when trading any of the yield curve trades using futures, you need to be aware of what the proper weighting is for the Front and Back legs. This is because you need to remove the price risk associated with the futures contract due to the non-linear relationship between price and yield. To do this we need to find out how much a contract changes in price for each basis point in yield. This is called the Dollar Value of One Basis Point or DV01. Once we have the DV01 of each contract we can divide one by the other to get the ratio. This will be the weighting, or ratio between the front and back legs.
The calculation for DV01 is a bit involved. You can use a spread sheet and devise your own calculator, or you can use one that the CME Group provides here.

The goal of the ratio is to create relatively equal sided trades in terms of yield. It’s similar to options trading where you attempt to make your trade delta neutral. In this case we can see that the DV01 for the 2-year is approximately 1/2 that of the 10-year DV01 ($37.04 and $78.90 respectively). So it will take two 2-year contracts for each 10-year contract to create a Dollar Value neutral trade.

Edward 3rd
February 7, 2019 at 1:02 pmThis is incorrect. The TUT ratio is 1:1 because of notional size of ZT (200k) vs ZN (100K). You double DV01 of ZT.
Not to be confused with notional value of ZB 100k and ZN 100k so we get 3:1 on NOB.