I’m going to say it right up front…you don’t need any special knowledge to use Statistical Arbitrage, also known as StatArb. All it is, is a fancy name for pairs trading. But even that term, pairs trading, makes some traders unsure. It has too many moving parts, and people struggle to understand how one profits by buying one asset and selling another.
But it’s not that complicated, StatArb removes the one thing from analyzing the markets that is so difficult to achieve, and that’s predicting direction. StatArb is agnostic to direction, it allows you to profit under conditions that might normally seem untenable. The amazing thing about a StatArb trade is that it trades the relationship between two correlated assets, which by its very nature provides a well defined and highly probabilistic edge.
Another great thing about StatArb is that it provides risk aversion in a naturally hedged position, you don’t have to care which way the market goes, and with futures you get substantial discounts on the cost of the trade. And all you have to do is follow a couple of very simple rules.
Is StatArb a fool-proof methodology? No, but it does remove most of the things that haunt directional traders. The only real problem with StatArb is the availability of easy to use, and intuitive tools across popular trading platforms. That’s probably the principle reason that retail traders have not adopted the strategy.
How Does StatArb Work?
The whole premise of a StatArb pairs trade is to match two highly correlated assets and trade the difference in value. This difference in value represents the change in relationship. If two things are very similar, and the relationship gets disrupted, there’s a high probability that the relationship will eventually regress back to its norm.
So, the way you trade StatArb pairs is wait for a disruption, measure that disruption using statistical measures, typically one standard deviation, then take the trade by going long the underperforming side of the pair, and short the over performing side. Then you make money as the pair regresses back to their norm, closing that gap between them.
The probability that the divergence or disruption will repair itself is very high if the pair are highly correlated. Which basically means that they move with each other under all kinds of conditions. You can measure this level of correlation using statistical tools. The most common way is to measure the pairs correlation coefficient, which has a range of -1 to +1. A score close to +1 means the pair is correlated. Most StatArb traders consider a score > 0.5 to be good enough to trade.
There are mathematical proofs that show very high correlations (> 0.70) make the probability of a regression virtually a given, greater than 75%. This is the kind of edge traders dream of.
How Do You Chart the Relationship?
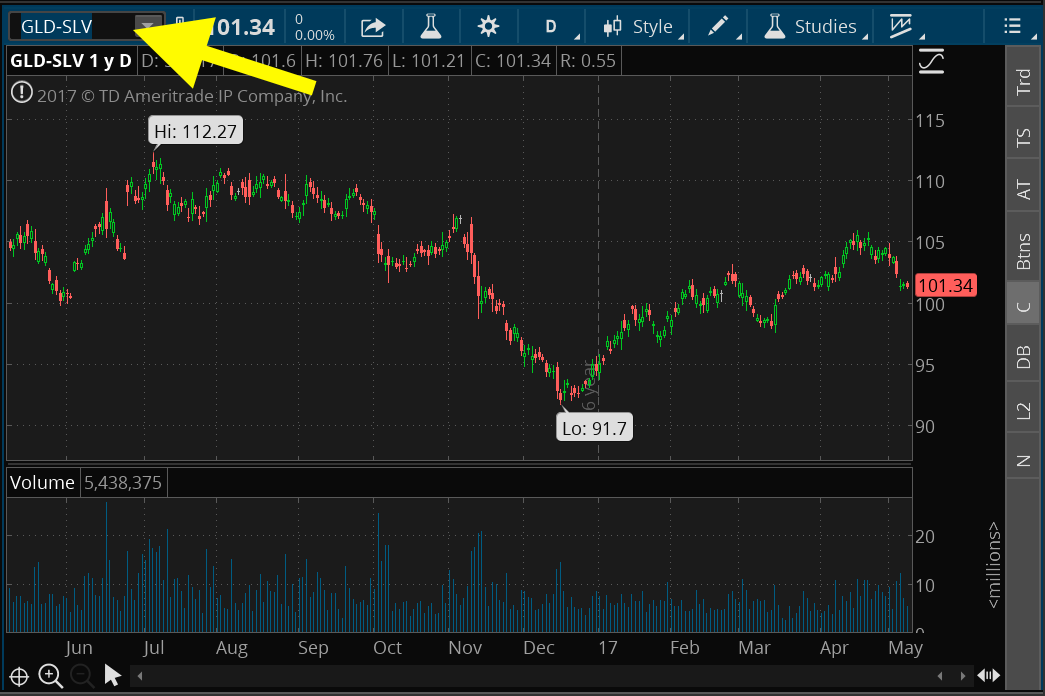
Most trading platforms allow you to include 2 or more symbols on a chart, then use scripts to plot the relationship. Some platforms do it better than others. Let’s look at Think or Swim (ToS) for example. To plot two stocks or futures is very simple, let’s look at the Gold and Silver ETFs GLD and SLV respectively. You can enter the simple formula “GLD – SLV” in a chart and ToS will plot it.
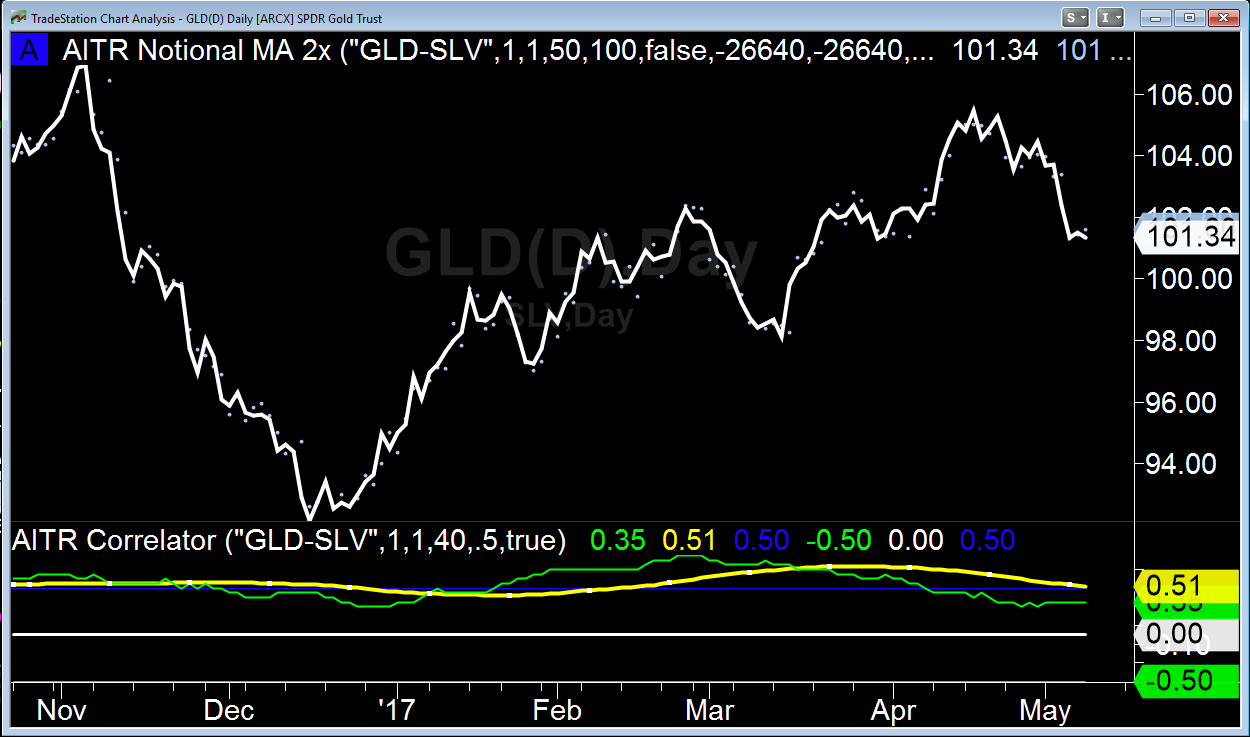
By the way, there are lots of great tools for calculating correlations of stocks and ETFs on the web, here’s one specifically for ETFs. Below is a chart created with TradeStation, using special indicators that plot the pair for you. There’s also a Correlation indicator showing the running correlation Coefficient, currently at 0.51. The correlation shows that the correlation has been steady, hovering a bit above the 0.50 mark.
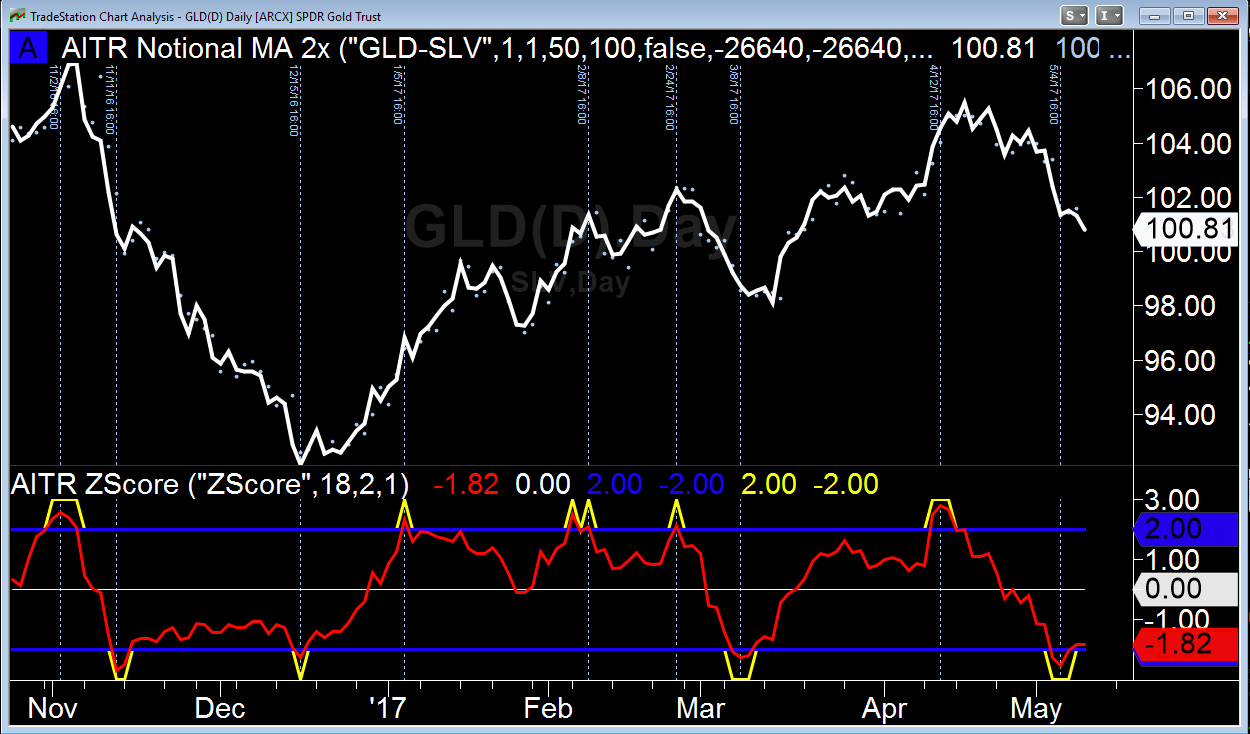
Both these charts plot the value of one share of GLD minus the value of one share of SLV, currently at $101.34. You can apply any kind of traditional charting tools and indicators to determine buy and sell points, just like any single stock or ETF or future. But because we are doing statistical Arbitrage, it is generally accepted that you will measure pivots points using statistical tools. A very common tool to use is called Z-Score. It’s shown below.
A Z-Score indicator is similar to an RSI or Stochastic, but it shows the number of standard Deviations the pair has moved relative to a zero line. The indicator below has a 2 standard deviation alert line that generates a signal when the pair has moved that amount. These are potential places that you might use to take trades
The chart above is for illustrative and educational purposes only. I’m not implying a trading strategy or recommending that these trades should be taken. In fact, there’s still more work to do before you get to that point, just like any strategy. But keep in mind, we’re plotting the relationship between GLD and SLV, not the direction of any one of them, so our strategy should be predicated one that idea.
While some people might just plot the two ETFs and think that’s good enough, but it’s not. You need to make sure both assets are equally represented in terms of their underlying value, also known as the Net Asset Value (NAV). In other words, you have a ratio of shares that represent an equivalent value of gold and silver. There’s a fairly substantial amount of academic and practical research that shows this is necessary. With an ETF this requires some research. With futures it is a simple calculation of multiplying the quoted futures price by the asset’s Big Point Value, which is a component of every futures product.
My TradeStation indicator, which I developed, plots pairs of assets, and automatically does the value calculation for you when you apply two futures products. You can also specify any ratio of contracts you want. Some pairs require a certain ratio in order to get the full discount on your margin requirements. This is a feature of futures, not stocks and ETFs, where the Chicago Mercantile Exchange determines this discount based on their reduced risk calculation as a result of your hedged position. In other words, it’s cheaper to trade futures when doing StatArb than stocks, and you get way more leverage and tax benefits too.
How To Execute a Pairs Trade
This is the final thing you need to know in order to execute a pairs trade. You must execute both sides of the trade simultaneously. Do not try tole into a trade by executing the long then the short or vis a versa. You may get away with it a couple of times, but eventually you will experience pain. But don’t fret, there’s a super simple way to execute both sides of the trade at the same time. It’s a feature in most trading platforms called Order Sends Order (OSO). You simply setup the OSO order and execute it with one button click.
TradeStation has something called Staged Orders in the TradeManager that lets you set up OSO orders. Think or Swim has a couple ways to do it, the easiest is to use their Pairs Trading Platform. The other way is to set your order to Blast All and add both sides of the trade to your order list. And that’s it!
Conclusion
Once you have done these few required things, trade a correlated pair, execute the trade simultaneously with an OSO order, you are good to go. You just need a plan and a strategy, and you can become a Statistical Arbitrageur, making high probability trades, without a care as to which way the market is going.


Vernon
March 25, 2019 at 10:11 pmGreat information I would truly like to learn more that I could begin trading in a demo account. Does your organization offer online courses ?