Statistical Arbitrage is a pairs or spread trading strategy, predominately used by hedge funds, investment banks, and professional traders. The strategy involves tracking the difference in notional value between two highly correlated instruments, like Silver and Gold futures, or the NoB spread, which is a trade between the 10 year and 30 year treasury futures contracts. The notional value is the actual cash value of a futures contract. Statistical Arbitrageurs trade the notional difference of the pair. Here is how you calculate the notional value of a futures contract, and then the notional difference between a trading pair:
Notional Value = Current Price x Big Point Value

Notional Difference A & B = Notional A - Notional B
There are three key features in this strategy. The first is that when the difference in value between a trading pair changes in a statistically significant manner, perhaps due to some market shock, there is a high probability that that change will regress back to an average or statistical mean value. There are mathematical proofs that show the probability of regressing back to the mean is 75%. Second, futures have tremendous leverage, presenting an opportunity for high return on capital. And third, most futures brokers provide a substantial discount on the total margin of a pair due to perceived reduced risk, this means pairs trades use much smaller amounts of trading capital, so more flexible risk management can be employed.[/vc_column_text]
This is a classical regression to the mean strategy, where the difference between prices is tracked, rather than just a single price. The pairs must be highly correlated assets. So, if ABC is positively correlated with CBA, and suddenly ABC is up 20 points, while CBA is down 20 points, we can assume this price dislocation is an unusual and a temporary condition, that will eventually revert back to a mean. Profit is derived from taking a position during that regression by going long the under performing asset, and short the over performing one. As they regress, profit is realized.
When selecting pairs to trade, it can be very important to draw on fundamentals, as well as statistics, to help identify relationships between two instruments. Start by pairing one instrument in a particular sector or industry with an equal dollar value and correlated instrument, typically in the same sector or industry. Look for instruments that are not only highly correlated, but also trade with good liquidity, can be easily shorted, and with minimal slippage. Example pairs might include futures contracts for Gold and Silver, Crude Oil and Gasoline, Treasury Notes and Bonds.
When selecting pairs to trade, it can be very important to draw on fundamentals, as well as statistics, to help identify relationships between two instruments. Start by pairing one instrument in a particular sector or industry with an equal dollar value and correlated instrument, typically in the same sector or industry. Look for instruments that are not only highly correlated, but also trade with good liquidity, can be easily shorted, and with minimal slippage. Example pairs might include futures contracts for Gold and Silver, Crude Oil and Gasoline, Treasury Notes and Bonds.
Determining how well a pair of assets are correlated is important to determining the viability of pair. Remember, pairs with a high degree of historical correlation have strong regressive tendencies (75% or higher). This presents an incredible edge to traders.
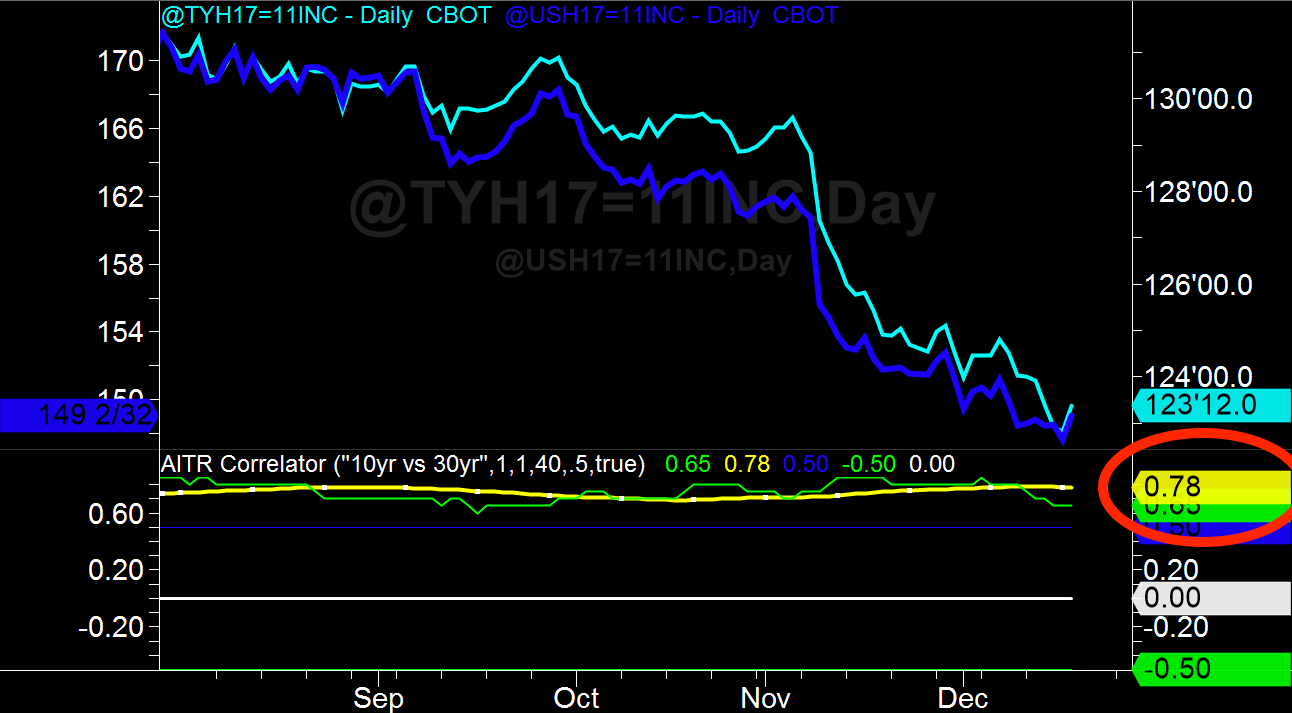
A correlation coefficient is a statistical method that measures how well the price of a pair of assets moves relative to each other tick by tick. The more they move together, the higher the correlation coefficient. Values of the correlation coefficient range from -1 to +1; with a value of +1 representing a perfect positive correlation (two instruments move in the same direction every tick), a value of 0 representing no correlation, and a value of -1 meaning perfect negative correlation (When two instruments move in perfect inverse to one another).

Correlations of 0.75 or above are often used as a benchmark for Statistical Arbitrage traders. Correlation less than 0.5 is generally looked upon as a weak correlation. Factors that can weaken correlation between a pair over time include supply and demand factors, politics, interest rates, economic growth, environmental factors, etc.
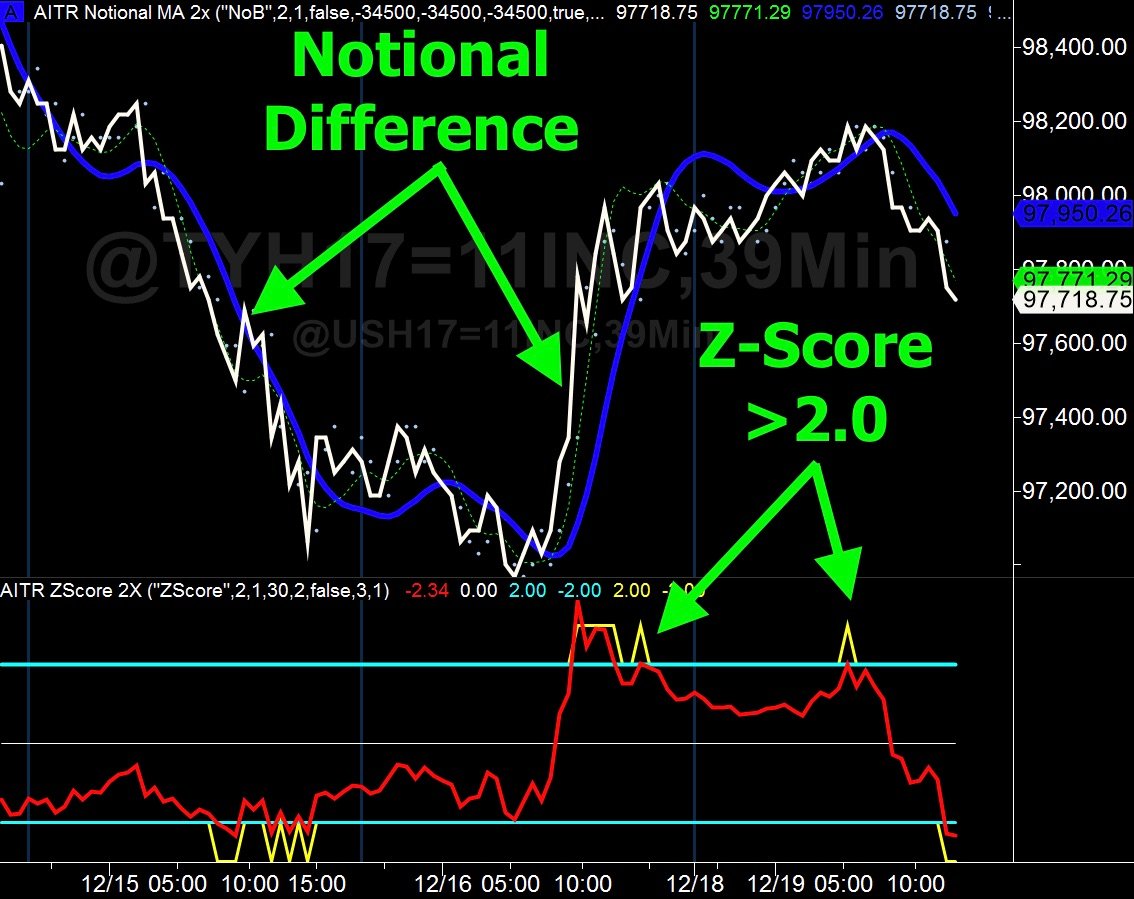
To tell whether a divergence is worth placing a trade, we need to measure the move using a statistical tool. The Z-Score is often used for this, it is a measure of a price movement relative to its mean or average price. Specifically, the Z-Score is calculated by taking the the difference between the current price and the average price, and then dividing that by the standard deviation of the current price over a specific period of time. We calculate the Z-Score this way:
Z-Score = (price - Avg( price, length)) / StdDev(price, length)
A common trading strategy is to watch over bought and over sold conditions on the Z-Score when it exceeds plus or minus 1.5 to 2 standard deviations. For example; one would short the pair if the Z-Score moved above +2 standard deviations, and go long should it fall below -2 standard deviations.

Through back testing and optimization strategies, trading opportunities can be found when the notional value diverges “X” number of standard deviations from the mean. You may further find that adding filters or price sizing strategies will further improve the probability of a successful trade.
Technical analysis, fundamental analysis, or a combination of the two can be used to find trading opportunities. Fundamental factors could include major economic events, long-term trends, monetary policy, growing seasons, etc. Technical analysis might involve one or more of the following; statistical measures, analyzing chart patterns, moving averages, stochastic, RSI’s, commercial indicators, etc.
Pairs trading with statistical arbitrage is a great market-neutral strategy for high probability returns with reduced risk, but it’s necessary to have access to quality tools to model your opinions and execute the trades accurately and consistently. Also, finding a rock solid premise for trading a pair is important. In fact, the best pairs trades are ones that adhere to a fundamental condition of the pairs, or the market they are in. These conditions might determine exclusive trade direction, execution times, seasonality, or any number of domain-specific reasons that can make trading that pair extraordinary.


