
Yield Curve trading using futures has been the bread and butter of large institutions and professional traders for decades. This type of spread trading offers excellent returns and hedging opportunities in one of the most liquid markets in the world, US Treasuries.
In our opinion, broader adoption to this type of trading into the retail market has been hampered due to the lack of intuitive, easy to use tools. Spreads by their very nature are difficult to understand because of the moving parts. But the strategies most traders use are quite simple and super-reliable.
We offer custom trading tools that make it simple to execute spread trades with futures using the TradeStation platform. The tools are intuitive and easy to use, allowing the trader to take full advantage of the strategies employed by professionals. Check out our course on Trading the Yield Curve, to get these tools, along with one-on-one training and mentoring.
One of the benefits of trading yield curve spreads besides the incredible liquidity and reliable strategies, is the margin offsets, or discounts, making the cost of executing a yield curve spread trade very small relative to the capital you put to work. This allows the trader flexibility to be risk savvy, yet carry sufficient leverage to achieve impressive returns on capital.
The Yield Curve as a Leading Indicator
Since the late 1980’s there has been significant research done across the industry and within the Federal Reserve that documents the empirical regularity that the slope of the yield curve reliably predicts future real economic activity. For example, every recession has been preceded by a flattening of the yield curve.
The slope of the yield curve is primarily influenced by the central banks’ monetary policy and inflation expectations. The Fed will raise rates to cool down heated economies, and lower rates to provide stimulus. So, steep yield curves reflect periods of stimulus, and flat curves reflect periods of tight monetary policy.
A practical way to model this is with yield curve spreads, like the difference between the 10-year bond and 3-month bill treasury rates, to calculate the probability of a recession in the US 12 months in advance. The spread makes a low approximately 12 months prior to a recession. This chart goes all the way back to 1959.
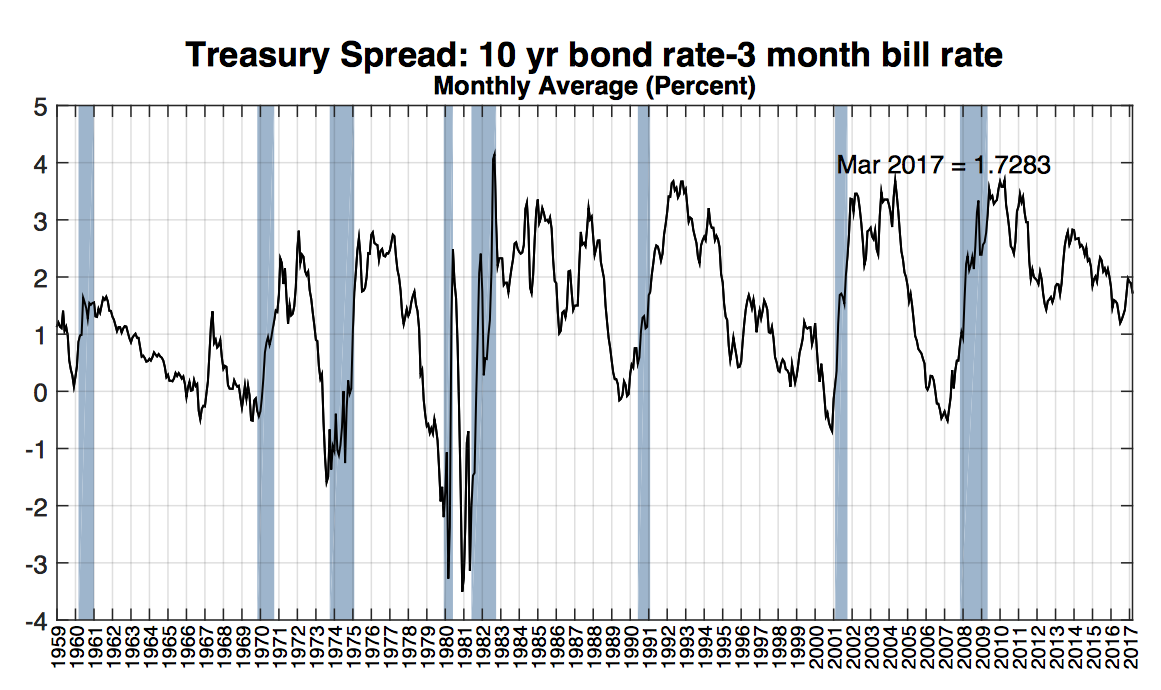
We can also model this using futures spreads like the TUT, or 2-year vs 10-year notes. Here’s a chart going back to the beginning of 2006, notice how well it correlates to the same period in the 10-year vs 3-month chart above, predicting the recession in 2009.

Yield Curve Strategies
The primary strategies employed by most professionals to determine the direction of the yield curve trade, look at whether the curve is steepening or flattening. A steep yield curve is the normal, healthy orientation of the curve, it occurs most often. The curve flattens usually as a consequence of the Federal Reserve policies, including rate hikes and liquidation of the balance sheet. These are policies that are employed in an attempt to cool down an exuberant market.
When we say go long the spread, like the TUT spread, we mean go long the shorter maturity leg (Front Leg) and short the longer maturity leg (Back Leg). The Front Leg is ALWAYS named first in the spread, so the TUT is the 2-year vs the 10-year note spread. So when we go long the TUT, we are long the 2-year and short the 10-year. We only go long when the yield curve is in a steepening mode, and we only take shorts when the yield curve is in a flattening mode.
Execution Risks
The risk in the yield curve strategy is measured using the DV01 (dollar value of a basis point), so you would calculate the DV01 of both the Front and Back Legs of the spread and find the ratio, this will determine the approximate ratio of contracts to use in the trade.
The CME Group does this calculation for you, and displays these ratios as a reference to traders on their website. The proper risk adjusted ratio to use for the TUT spread is 2:1, or two 2-year contracts for every one 10-year contract.
There are many other related yield curve trades using the various maturities, and each has an associated risk measure and recommended ratio of Front to Back Leg position size. By using this ratio, you more or less eliminate movement of the spread due to price, and isolate instead the movement of yield. Here are the popular yield curve trades using treasury futures and TradeStation symbols and the calculated DV01 ratio as of April 2017.
| Spread Name | Front Leg | Back Leg | CME Ratio |
|---|---|---|---|
| TUF | 2YR (TU) | 5YR (FV) | 1:1 |
| TUT | 2YR (TU) | 10YR (TY) | 2:1 |
| TUB | 2YR (TU) | 30YR Bond (US) | 3:1 |
| TUL | 2YR (TU) | 30YR Ultra Bond (UB) | 3:1 |
| FYT | 5YR (FV) | 10YR (TY) | 3:2 |
| FOB | 5YR (FV) | 30YR Bond (US) | 3:1 |
| FOL | 5YR (FV) | 30YR Ultra Bond (UB) | 3:1 |
| NOB | 10YR (TY) | 30YR Bond (US) | 2:1 |
| NOL | 10YR (TY) | 10YR Ultra Bond (TEN) | 3:1 |
| BOB | 30YR Bond (US) | 30YR Ultra Bond (UB) | 3:1 |
Is The Yield Curve Flattening or Steepening
So, the strategy is simple, you go long the spread when the yield curve is steepening, and short when it’s flattening. But how can you tell if the yield curve is steepening or flattening? A steepening curve is the predominant situation, in other words, long term rates are usually higher than shorter term rates, probably 70% of the time. But occasionally, when the Fed is attempting to reel in a market because of over inflation concerns, they might increase short term rates, causing the yield curve to flatten.
The big question in terms of flattening or steepening is, what’s the time frame you are trading in? If you are trading very short term, by that I mean similar to a swing trader, where trades are open for a couple days to a couple weeks, then your idea of steepening or flattening may be very different from someone trading long term, like a position trader.
I trade short term, so I want a measure that effectively captures the general direction of the yield curve, so that the choice of whether to go long or short, is for the most part coincident with the direction of the yield curve. This will give me the best probability of a successful trade, kind of like trading with the trend, the trend is you friend. So, I use the TUT or TUB spread weekly chart, and add a 2 line moving average, where the fast line is set to 25 and the slow line set to 30. I then look for cross overs to determine when the yield curve is changing direction.
The TUB spread covers almost the entire yield curve, where the TUT spread covers only a portion of the shorter term yields. You may have to experiment with this to find the best indicator. If you are a NOB trader, then maybe you are only interested in the upper end of the curve, so the FOB might be a better choice.
If the moving average slope is not very big, then you might want to hold on to the current strategy of steepening or flattening. Also, depending upon your entry strategy, it might make sense to favor either steepening or flattening. You’ll have to do the back testing to determine your own rules. I have developed a large set of conditions based on about a decade of trading yield curve spreads, along with detailed, multi-time frame analysis.
Here’s an example of using a notional chart of the FOB with 2 moving averages to determine the strategy to employ.
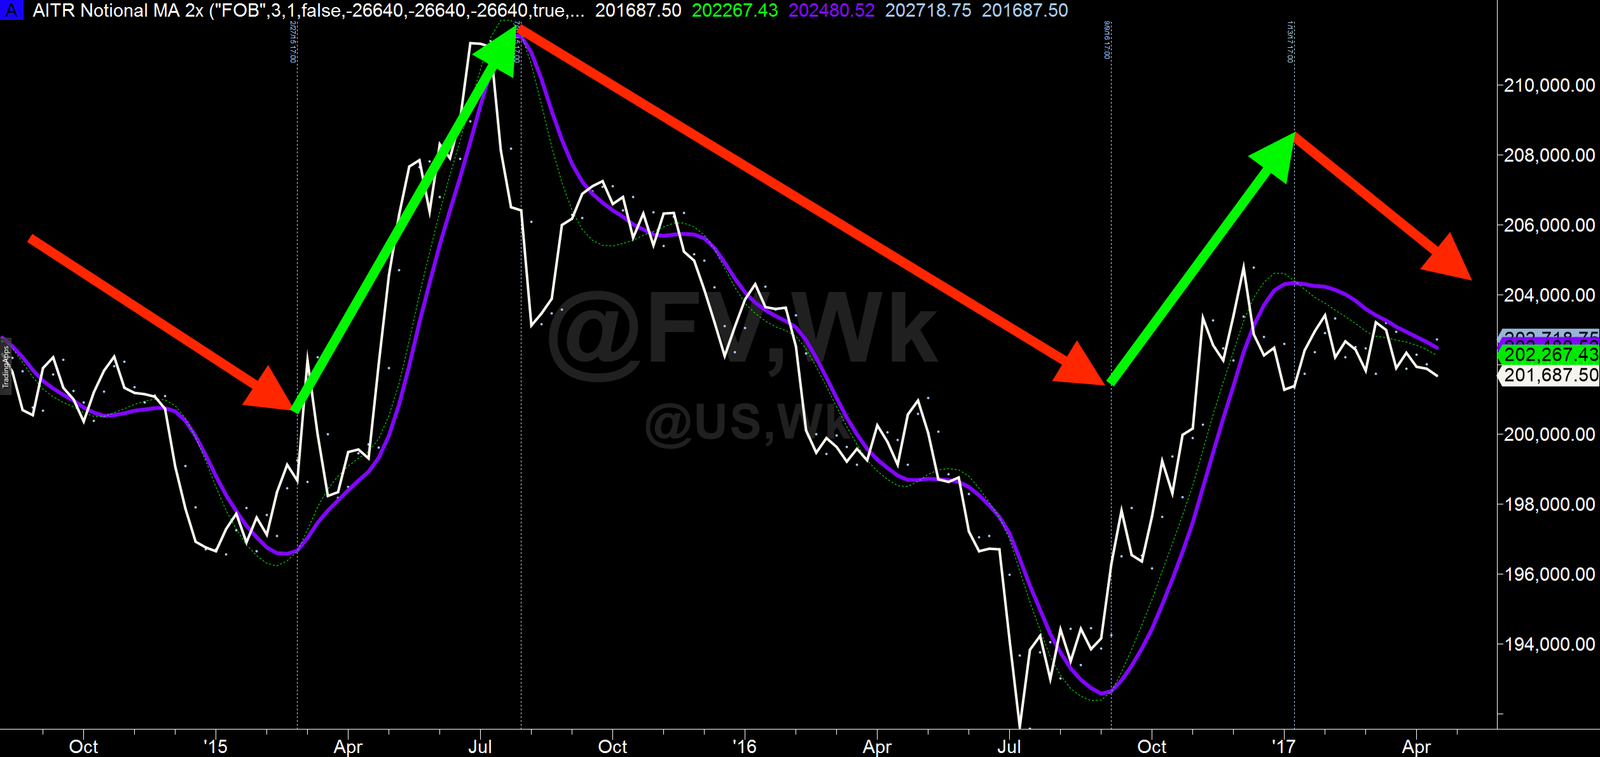
There are many ways to determine when to switch strategies. There are also effective sub strategies that layer on top of the steepening/flattening strategy that are very effective as well. One example might be trading only US economic reports and fading the move, or trading with the direction of the move.
If you would like to learn how to trade the yield curve, and obtain our tools that make trading it simple and intuitive, then click here to sign up for our one-on-one training and mentoring program.
