
When we speak of hedging, what we’re really talking about is a pairs trade, where we go long one asset and short another. We hedge to take advantage of several key aspects of Treasury futures. The most important is the edge we get by eliminating the directional aspect of price (minimizes risk) and focusing instead on yield direction. This is important, because the fluctuations of price are very difficult to trade, but the direction of yield is simple due to the slow moving Federal Reserve monetary policies.
The problem we face as traders is how to isolate yield from price of the individual treasury futures contracts. The way we do that is by translating the dollar value of the treasury instrument to the yield. This is called the DV01, or dollar Value of One Basis Point (of yield). So, by calculating the DV01 of each side of the hedge, we can then divide one by the other to get a ratio, and this ratio will represent the relative size of each side of the trade, and we can round that number to give us the ratio of contracts on either side of the trade.
This process requires a formula, which is nicely represented as an Excel formula, making it super simple to calculate the DV01, and thus the ratio we are looking for. This ratio changes over time depending on the price and yield on the treasury instruments. So periodically we have to check this ratio to update the position sizes we take with trades, to make sure we are trading changes in yield and not price.
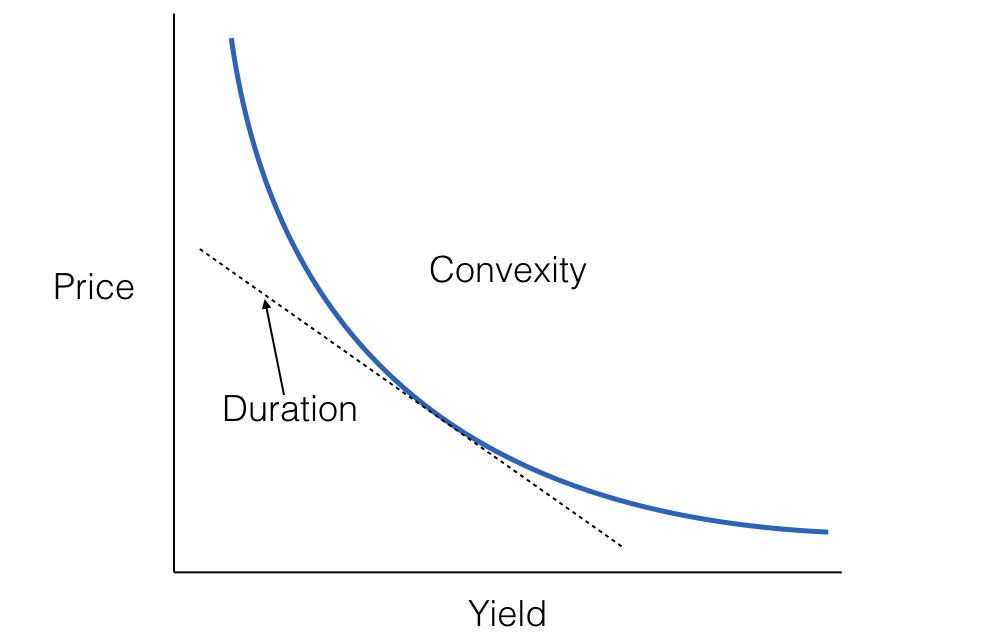
Here’s a diagram that shows the non-linear inverse relationship between price of a bond and yield. As the price of a bond goes down, the yield goes up in an accelerated fashion, when the price of a bond goes up, the yield goes down in a decelerated way. This shape creates a situation called convexity, which refers to the shape of the curve. The tangent line is an approximation of the price at maturity, called duration.
Calculating the DV01
There are two well known ways to calculate the DV01 of a treasury instrument (bill, note or bond). The first is to measure price sensitivity over a small incremental change in the security’s yield. The second way is using the treasury security’s modified duration. The duration method can be complicated, so we will focus on the yield sensitivity method, which is relatively simple.
The yield sensitivity method is accomplished by finding the difference between two absolute prices of the same treasury instrument over one basis point (bp) change in yield. Here’s the formula:
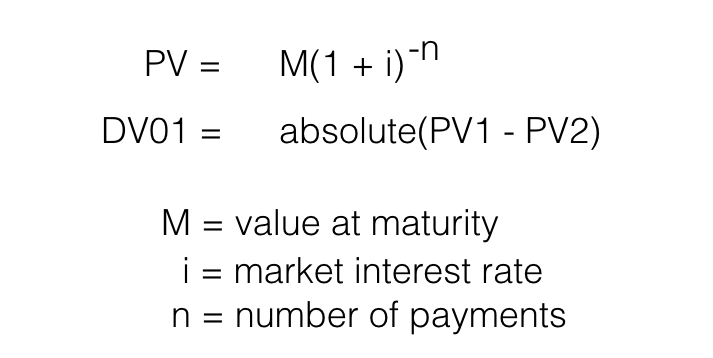
Using Excel’s PV function we can create a relatively simple tool to calculate DV01 of both sides of the pairs trade. All you have to do is input the current yield of the respective Treasury instruments. Below is a sheet that calculates the hedge ratio for the Notes over Bonds (NoB) trade. If you are interested in obtaining this Excel sheet, contact me and I will share it with you.
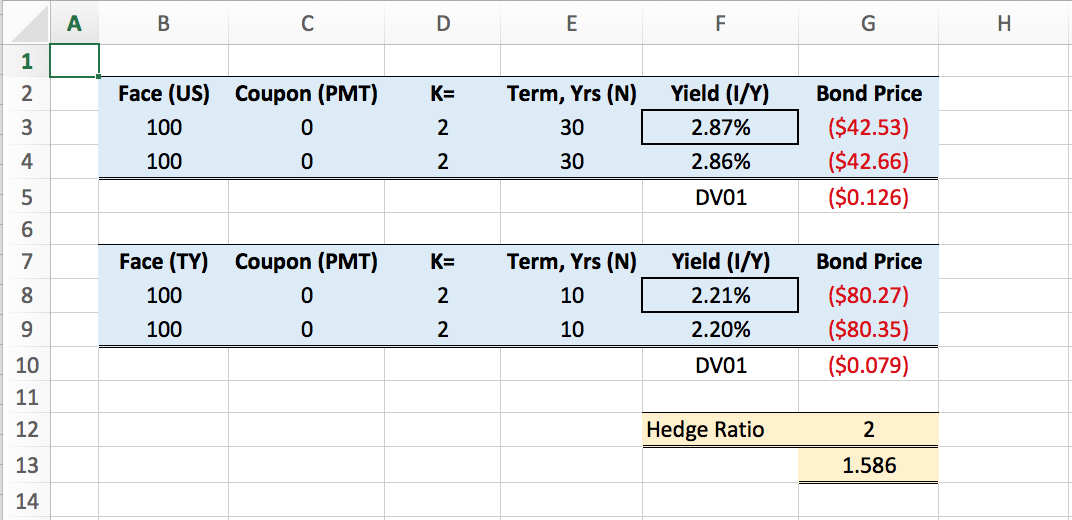
The hedge ratio rounds up, so the proper hedge of the 10-year Note vs the 30-year Bond is 2 to 1. So, using this ratio in your trade analysis removes the risk of trading non-linear price movements and instead trading only differences in yield. If you are interested in learning more about trading the yield curve I’m offering a course and mentoring program under the Learn tab

Said Ramic
April 15, 2020 at 3:55 amHello Ernie,
I am trading Treasury pairs and the biggest issue are the ratios. I use the CME ratios at the moment, but they are inaccurate. I would be happy to learn more about the DV01 ratios. Thanks