
Spread or pairs trading is a very effective way to hedge your risk exposure to the movements of the broader market. With pairs trades you can make profits through simple and relatively low-risk positions. The trade is market-neutral, which means the direction of the overall market does not affect profit or loss…it’s the change in the relationship between the pair that you are trading.
The primary goal in choosing a pair to trade is that they are highly correlated. This correlation ensures that you are trading the relationship and not the price. You make profit by waiting for the difference in price to diverge by some statistically significant amount. This change represents the divergence in the relationship. At some point this relationship has a very high probability of regressing back to the original price difference. The higher the correlation, the higher the probability that the relationship will regress back.
So, we use statistical tools to measure correlation with a measure called the correlation coefficient, which is on a scale from -1 to +1. A +1 indicates perfect correlation, while a -1 indicates perfect inverse relationship. There are virtually no pairs with perfect correction, but pairs with coefficients above 0.70 are considered to be candidates for pairs trading. Mathematical proofs have shown such pairs have a 75% probability of regressing after a divergence.
This is a very strong edge that traders can use to their advantage. And the reason why pairs trading is so popular with hedge funds, investment banks and professional traders. Very few retail traders use the strategy because there are few good intuitive to use tools available. FYI, if you take my course you will be provided such tools.
Finding Great pairs Can Be Challenging
Unless of course if someone does it for you. And that’s what I have done for you here. I have ferreted out the futures contracts that have the highest correlations. I personally trade most of these pairs using a proprietary methodology and set of rules, employing a strategy called statistical arbitrage.
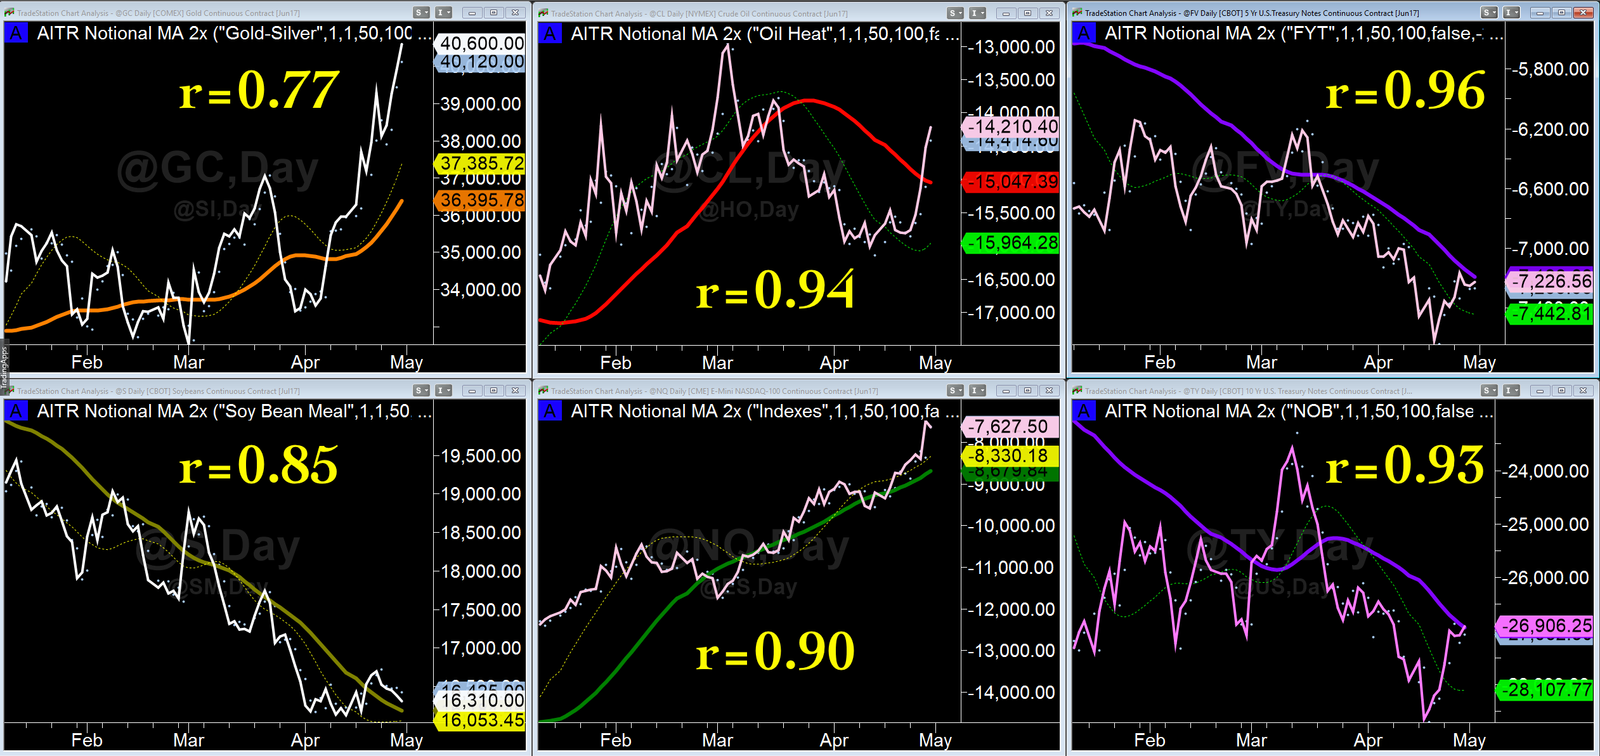
The “r” value is the correlation coefficient of the pairs shown. The charts plot the difference in the notional value of the pairs. That’s what we analyze using statistical tools to determine when to act on the trade. All the pairs use a ratio of 1 to 1. Meaning the smallest position size would be 1 contract long and 1 contract short. My favorite trades happen to also be the most highly correlated. Two are Treasury futures called the NoB and FYT, and the other is an Energy futures pair called the Oil-Heat which is a type of Crack Spread.
There’s a fantastic tool available on the CME Group website that helps identify the most highly correlated pairs called the Cross Correlation Calculator. The screen shot below shows the tool, and I have blocked off the most correlated pairs. There’s very few that every achieve a correlation Coefficient higher than 0.60, which is the standard I used for blocking them off. I wouldn’t trade the pair unless it had a value greater than 0.75.
In future articles I’ll go over each of these pairs and talk about specific strategies that can be employed on top of the basic statistical arbitrage strategy that will further increase your probability of profit. If you would like to learn how to execute those strategies now, then sign-up for my course, it’s a fantastic value, and includes one-on-one lessons and mentoring.
